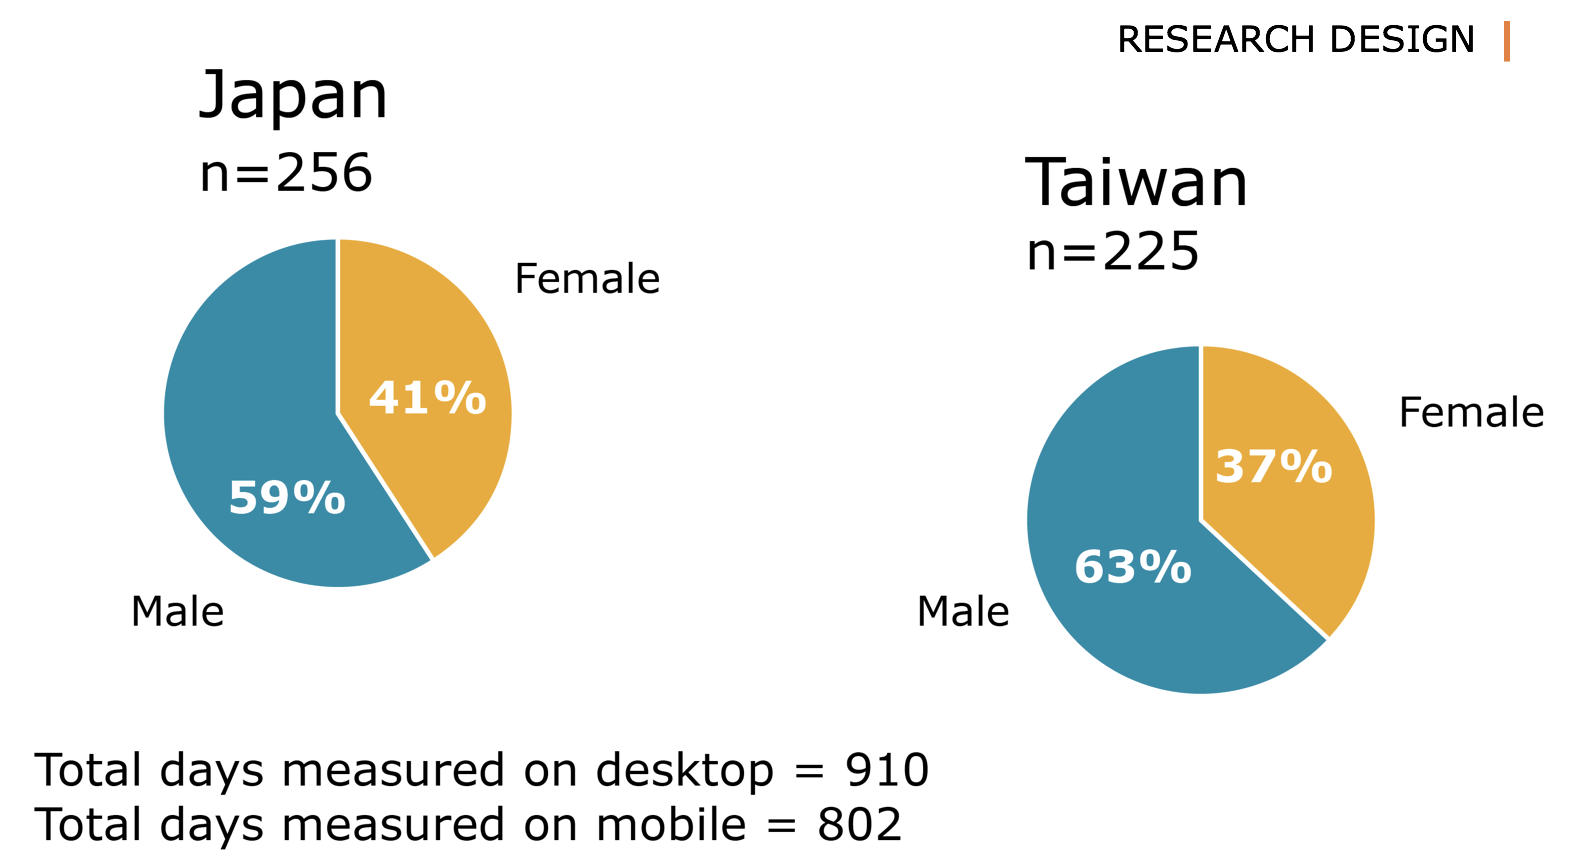
Using a pre-survey, we targeted consumers in Japan and Taiwan who were considering purchasing a smartphone in the coming month. When adding up the total measured device usage, we tracked 910 days on desktop, and 802 days on mobile across all participants.
Research Results
Device Usage
The first and most striking difference we found when we examined the data of both countries was the discrepancy in device usage.
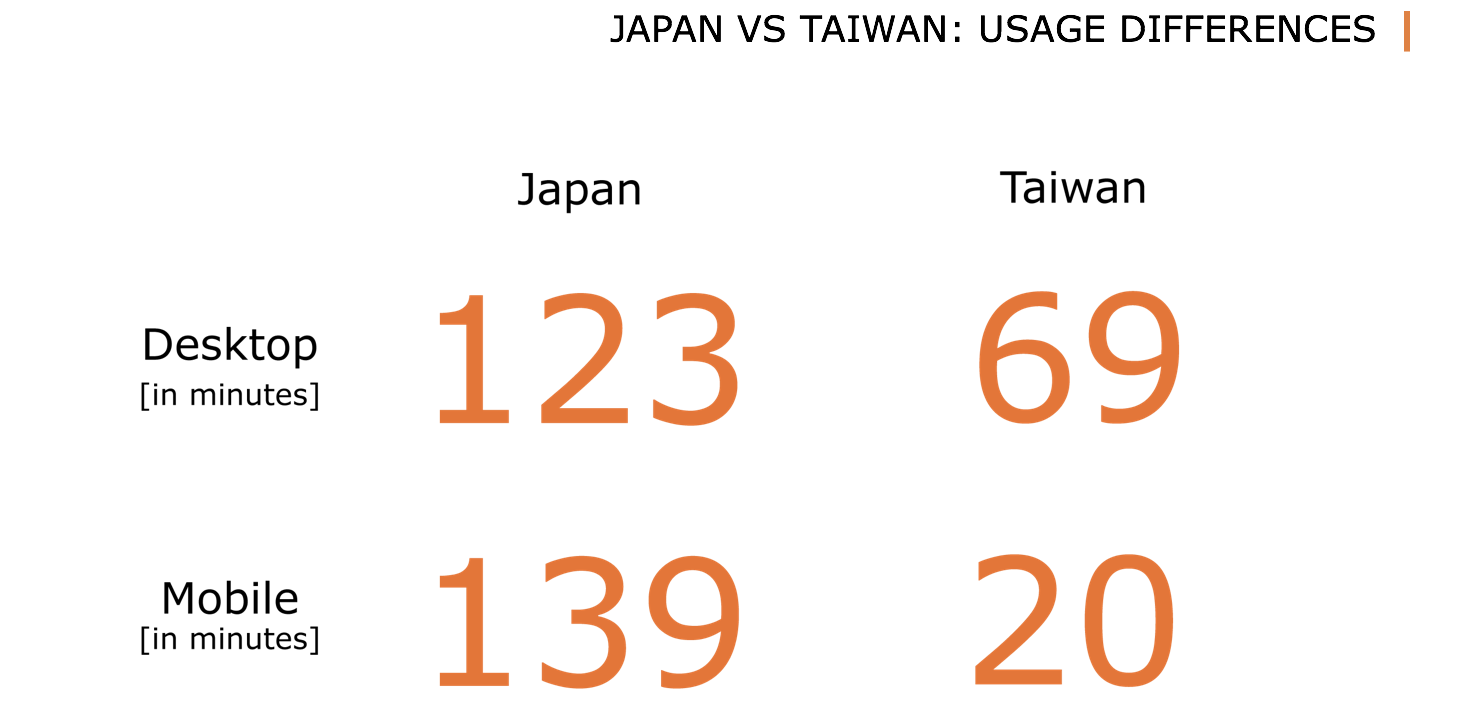
Taiwanese panelists spent roughly 1 ¼ hours on their desktop device per day on average, and only 20 minutes on their mobile device. In contrast, Japanese panelists spent 2 hours on their desktop, and 2 ½ hours on their mobile device per day on average.
This means that Japanese panelists spent almost twice as much time on their desktop, and almost seven times more time on their mobile devices than our Taiwanese panelists.
Moreover, Japanese panelists spent roughly 15 more minutes on their mobile than desktop devices, while Taiwanese spent 3,5 times more time on their desktop devices.
Top 5 domains
Apart from device usage, we also established a top 5 ranking of the most commonly used domains and apps across the panels. The ranking is made using reach, meaning the amount of unique visitors within the panel.
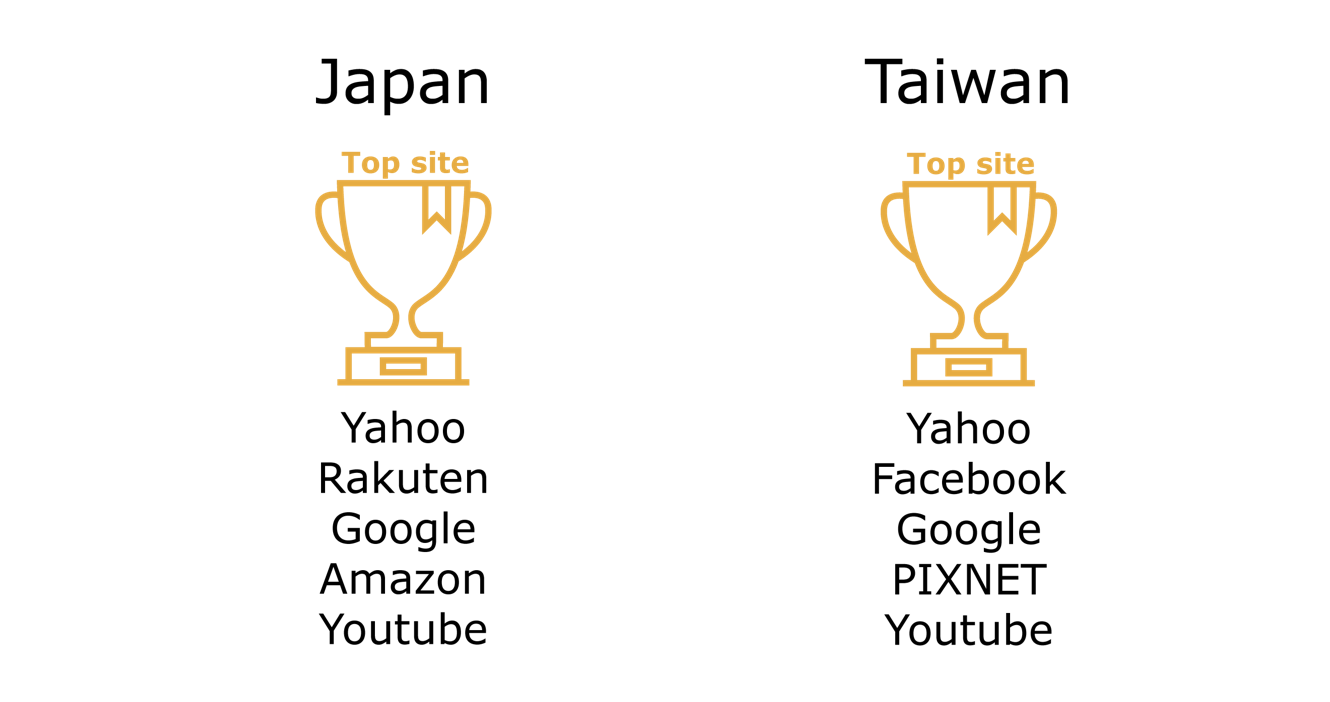
The top site for both countries was Yahoo. Yahoo has a strong presence in Japan and Taiwan being used more than any other search engine. However, it is used not only as a search engine, but also as a news site, a shopping platform, as well as for a variety of other functions. A notable exception from the Japan list is Facebook, which reached number 2 for Taiwan but came in at 6th for Japan.
If we rank the top 5 most used sites in Japan by total number of visits, it remains the same except YouTube and Amazon switch places. Facebook falls even further, becoming 13th.
For the Taiwanese top 5, if ranked by total number of visits, Facebook becomes number 1, followed by Yahoo, YouTube and Google. Ruten (a shopping site) joins the top 5 instead of PIXNET.
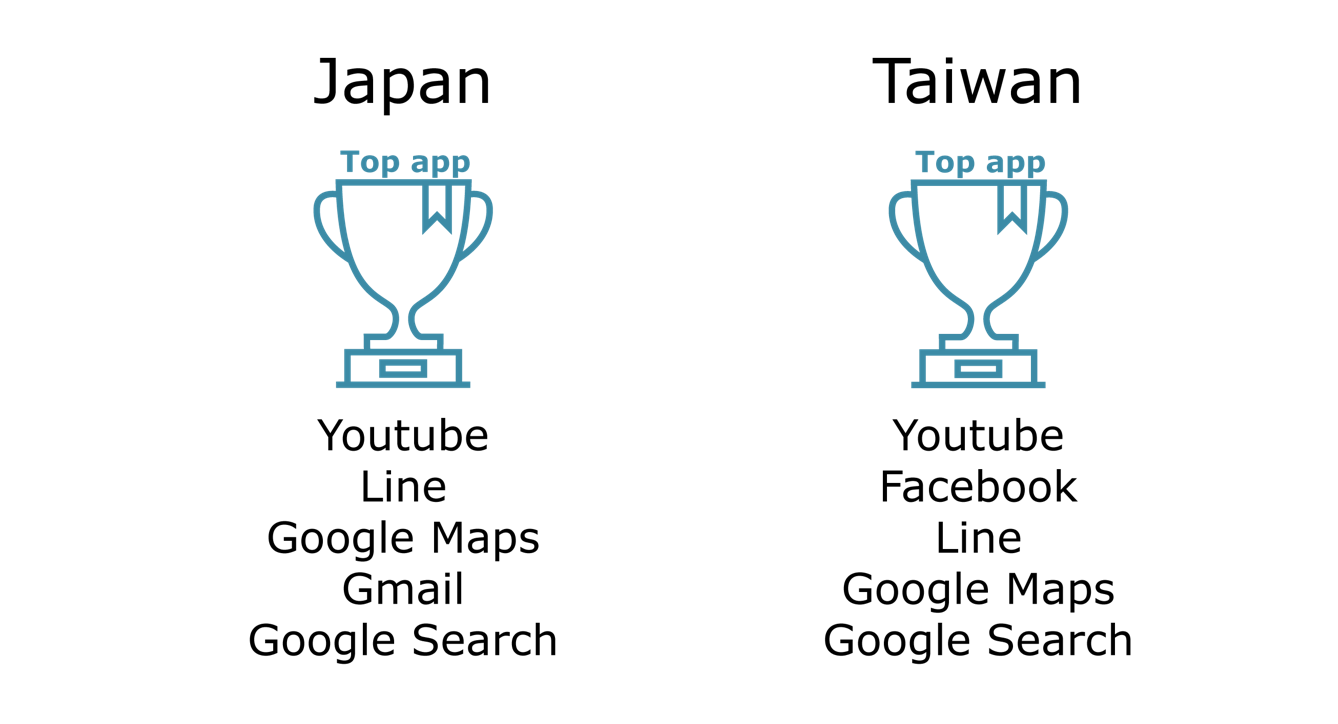
Top 5 apps
For both countries, similar apps appear in the top 5 – YouTube is number one, followed by a combination of Line, Google Maps and Google Search. Just like with the domains, it is notable here that Facebook is not present in the Japanese top five (only 51 unique visitors), yet ranks fourth for Taiwan.
Top domain per category
We also identified the top domain per category for both countries, and highlighted the most relevant and interesting ones here. We ranked the domains and apps according to reach percentage.
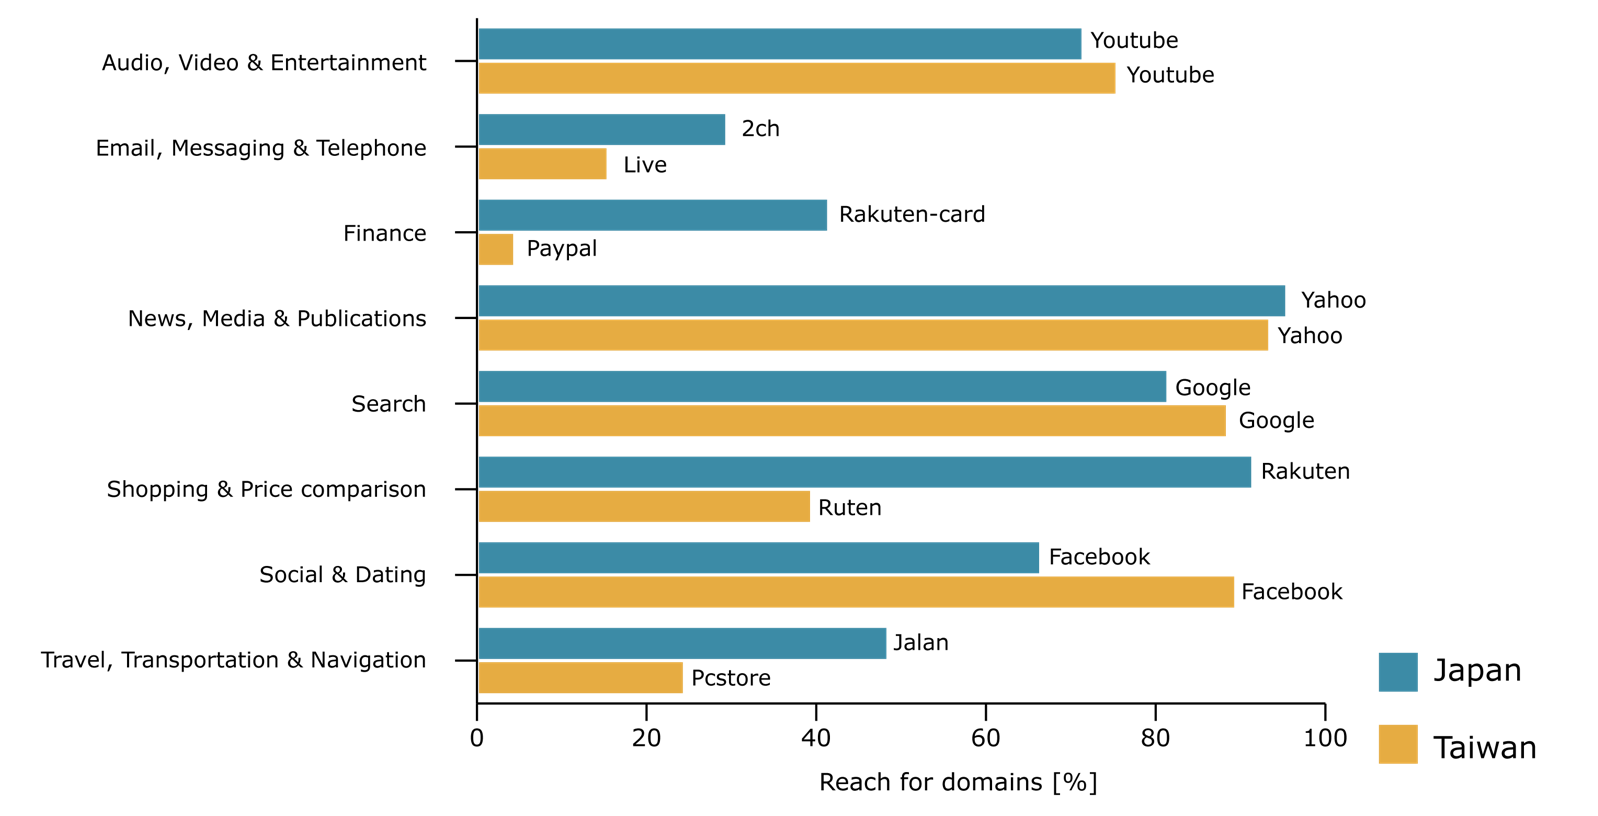
YouTube dominated the audio, video & entertainment category in both countries, having around 70% reach within the panels.
The highest reach in either panel was achieved by Yahoo, which is in line with the fact that it was the number one domain overall for both Japan and Taiwan.
While Facebook had the highest reach percentage in the social category for Japan, it was still relatively low when compared to Taiwan, where it was around 90%. This shows that there is more of an open market in social media platforms for Japan – in terms of total visits, both Twitter and Ameblo beat Facebook.
On the other hand, Rakuten had a much higher reach percentage in Japan than Ruten had in Taiwan, since there was less diversity in the shopping domains used in Japan than there was in Taiwan.
Top app per category
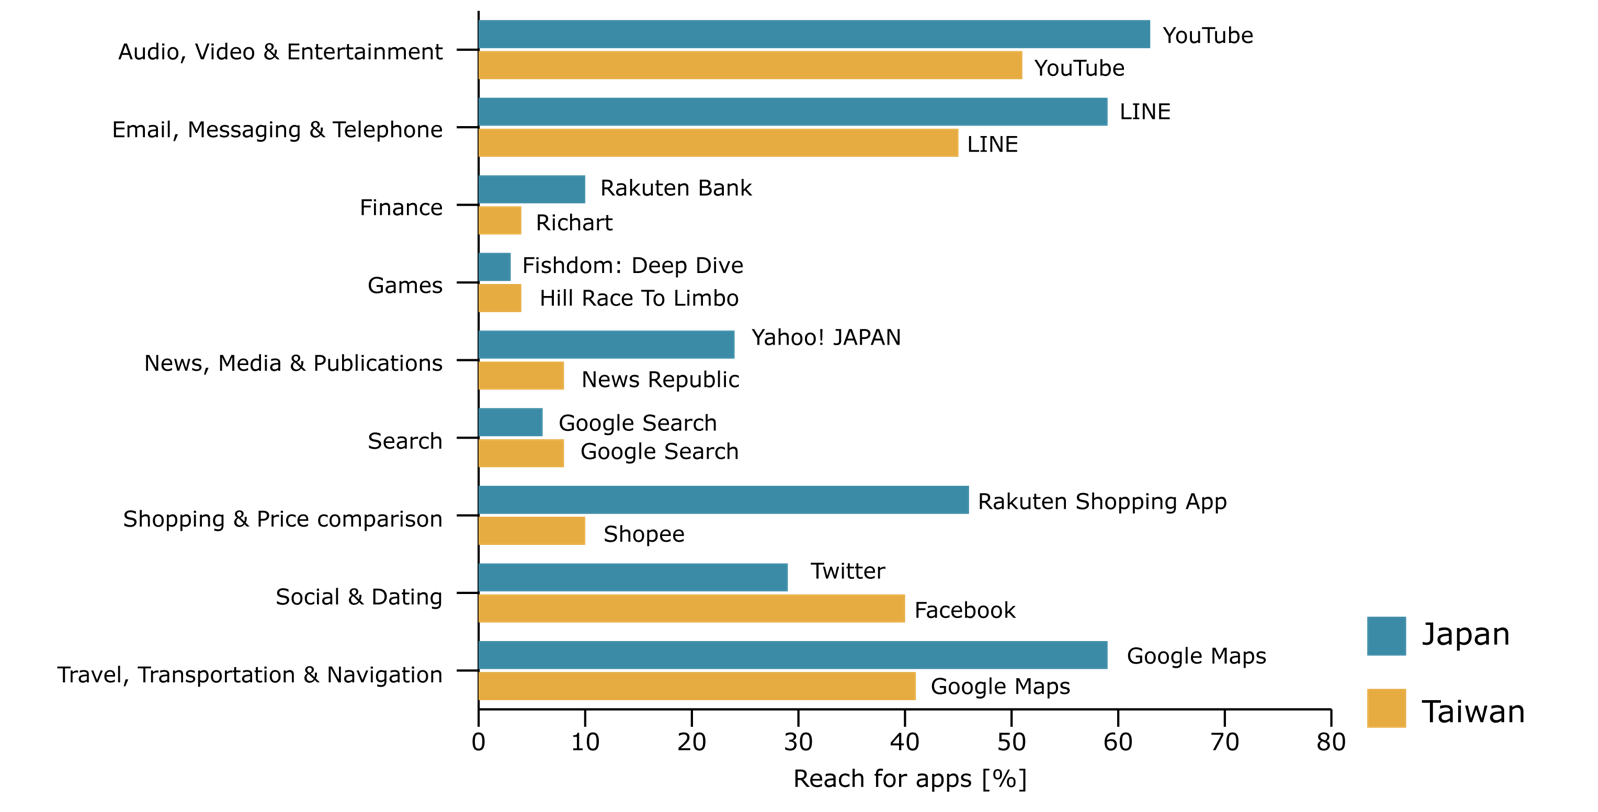
As with domains, YouTube is number one for audio, video and entertainment for apps as well. Here, we can also see the popularity of Line quite clearly, which is the region's most used messaging app with more than 560 million users across Japan, Taiwan and Thailand.
Yahoo makes an appearance again as the top news app for Japan, while News Republic is number one for Taiwan.
In terms of social apps, Twitter was ranked higher in reach percentage than Facebook for Japan, but Facebook was still number one for Taiwan.